> ## Documentation Index
> Fetch the complete documentation index at: https://lightdash-mintlify-e6012f7f.mintlify.site/llms.txt
> Use this file to discover all available pages before exploring further.
# Usage analytics
> To understand who is accessing content or running queries in your Lightdash projects, we've built usage analytics to help you track this.
There are two ways of understanding user activity:
1. [**Usage Analytics dashboards**](#usage-analytics-dashboards) - these are dashboards created by Lightdash which give you an overview of your project's content and user activity.
2. [**Query tags**](#query-tags) - this is metadata which is added to your data warehouse queries and gives you information about who is querying data and what they are querying.
## Usage analytics dashboards
Each project has usage analytics dashboards created by Lightdash giving you an overview of your project's content and user activity.
To see your usage analytics dashboards for a project, just click on the `settings` icon, `project settings`, then `usage analytics`.
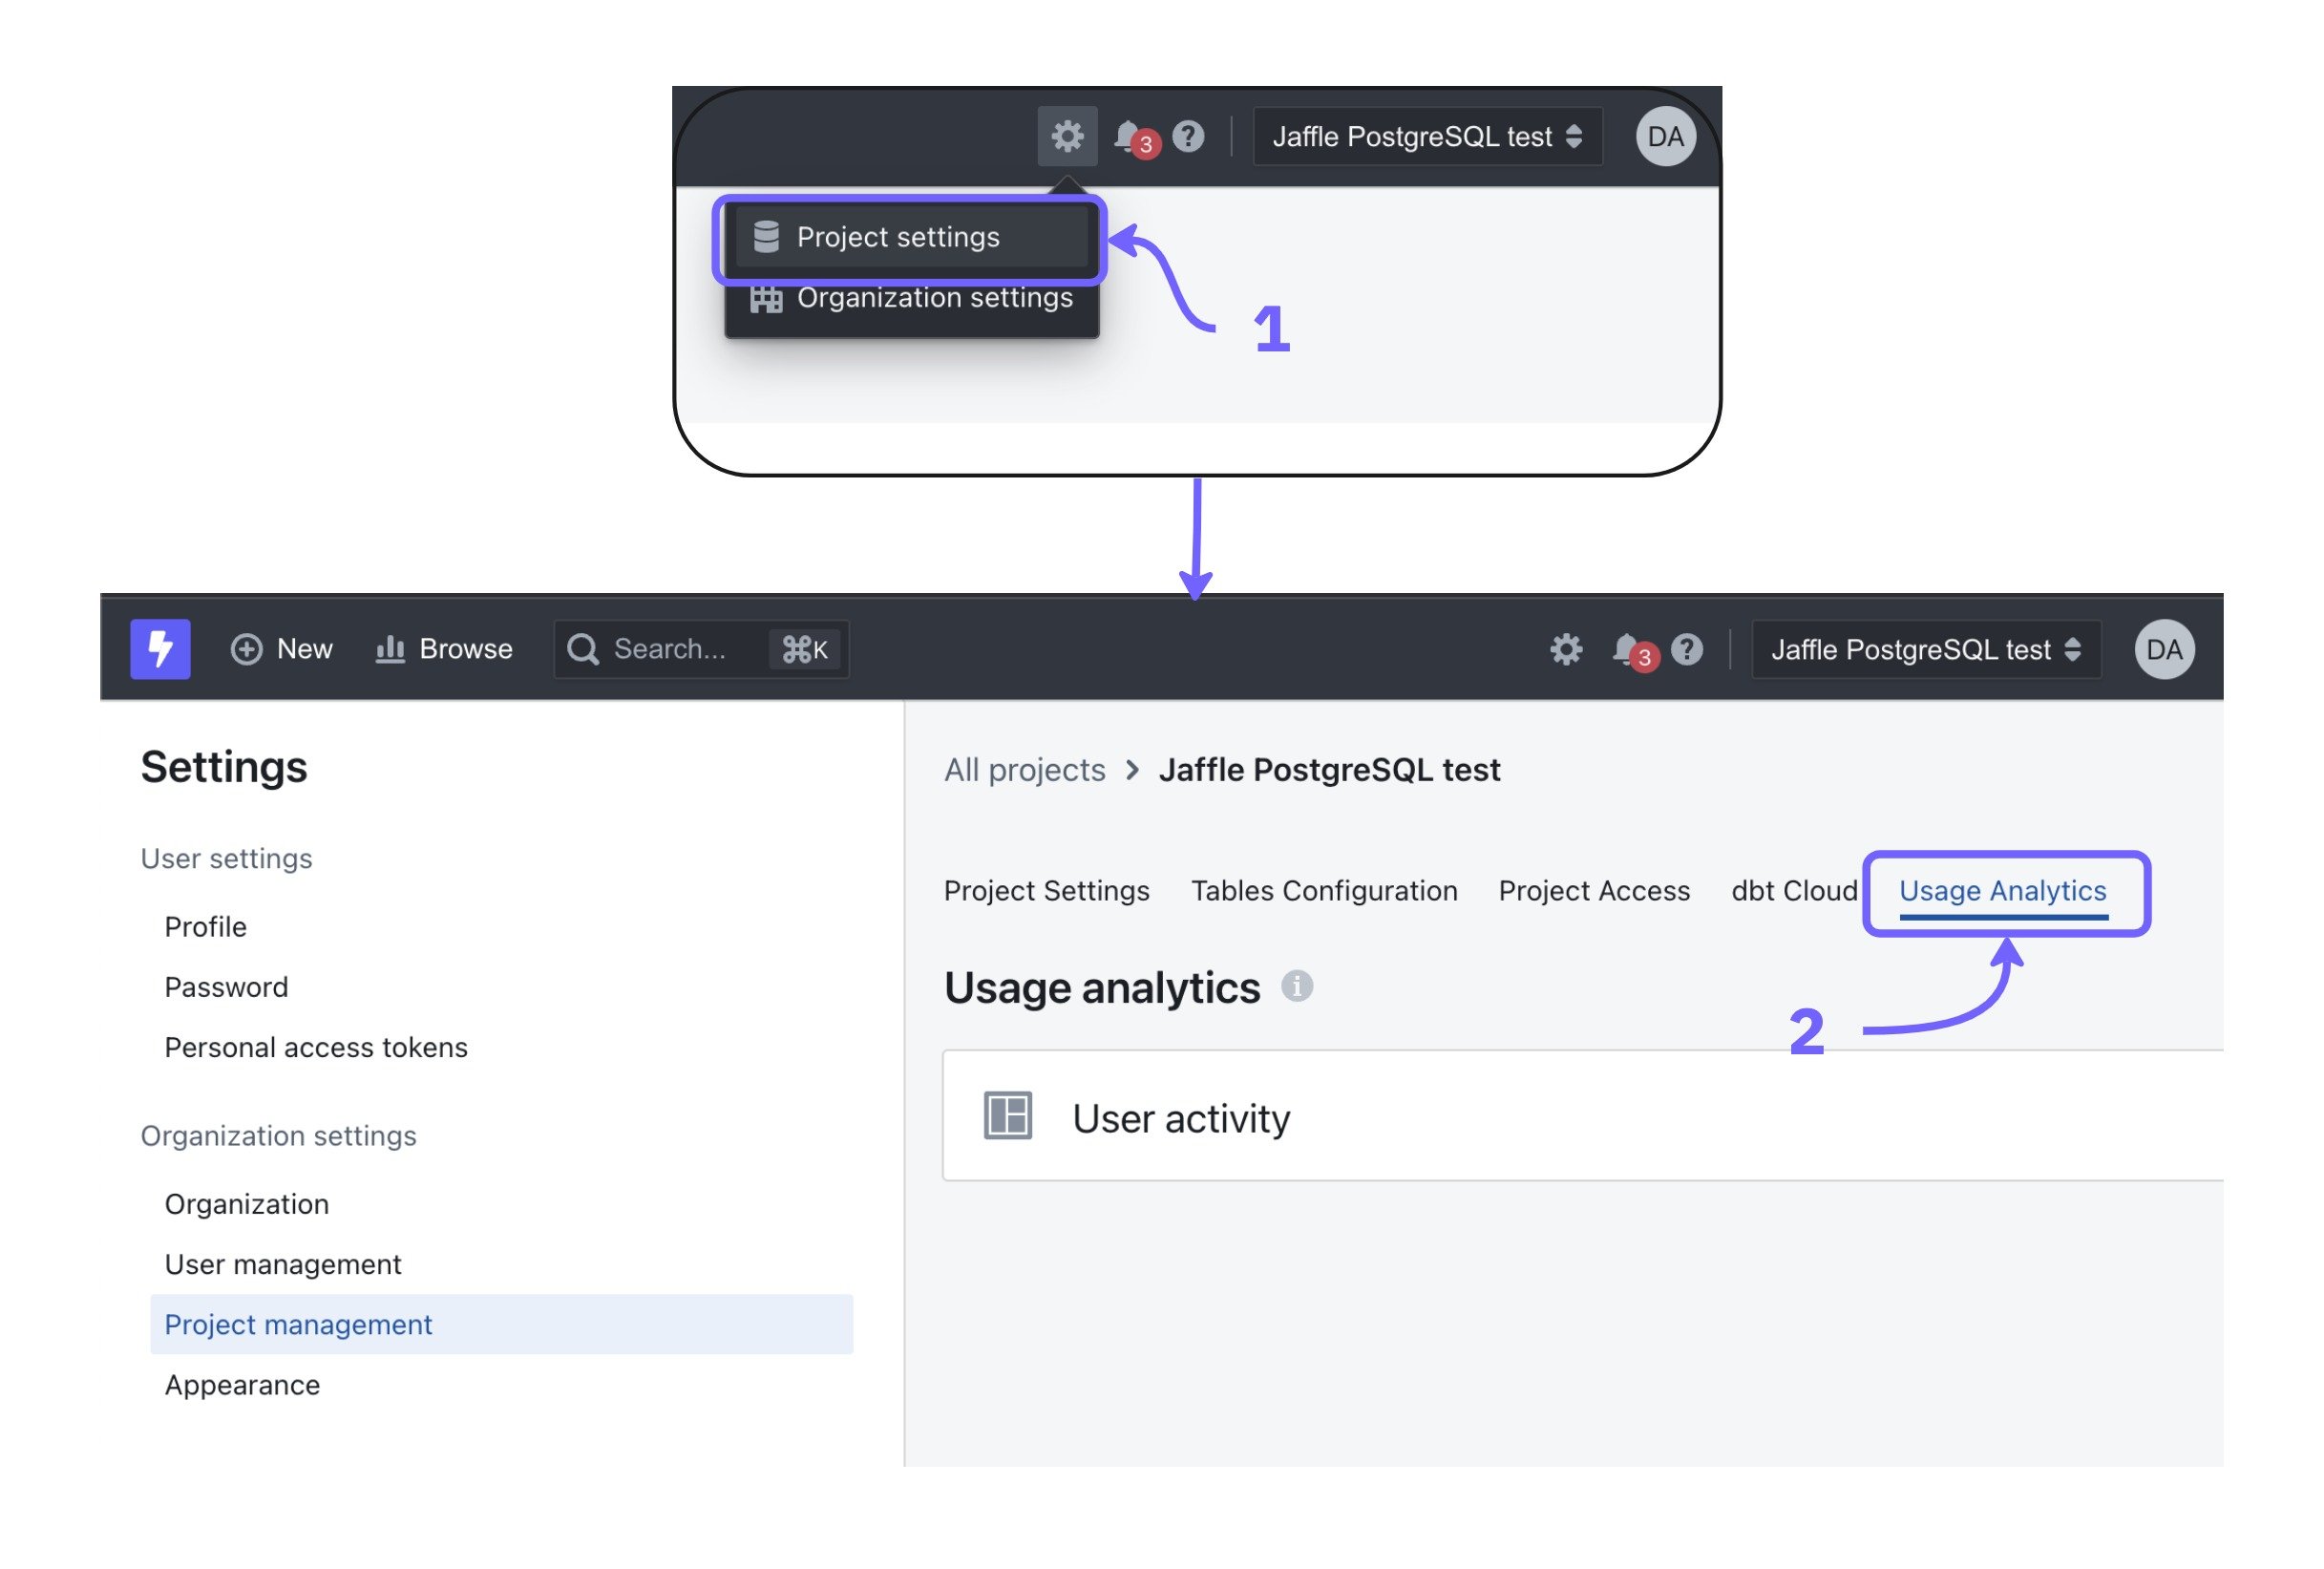 Or you can also use our [search bar](/get-started/exploring-data/exploring-your-content#using-the-search-bar) to get direct access to the different analytics dashboards by typing the name of the dashboard (eg: User activity)
### User Activity dashboard
This dashboard gives you an overview of the users in your project and the activity of your users.
Or you can also use our [search bar](/get-started/exploring-data/exploring-your-content#using-the-search-bar) to get direct access to the different analytics dashboards by typing the name of the dashboard (eg: User activity)
### User Activity dashboard
This dashboard gives you an overview of the users in your project and the activity of your users.
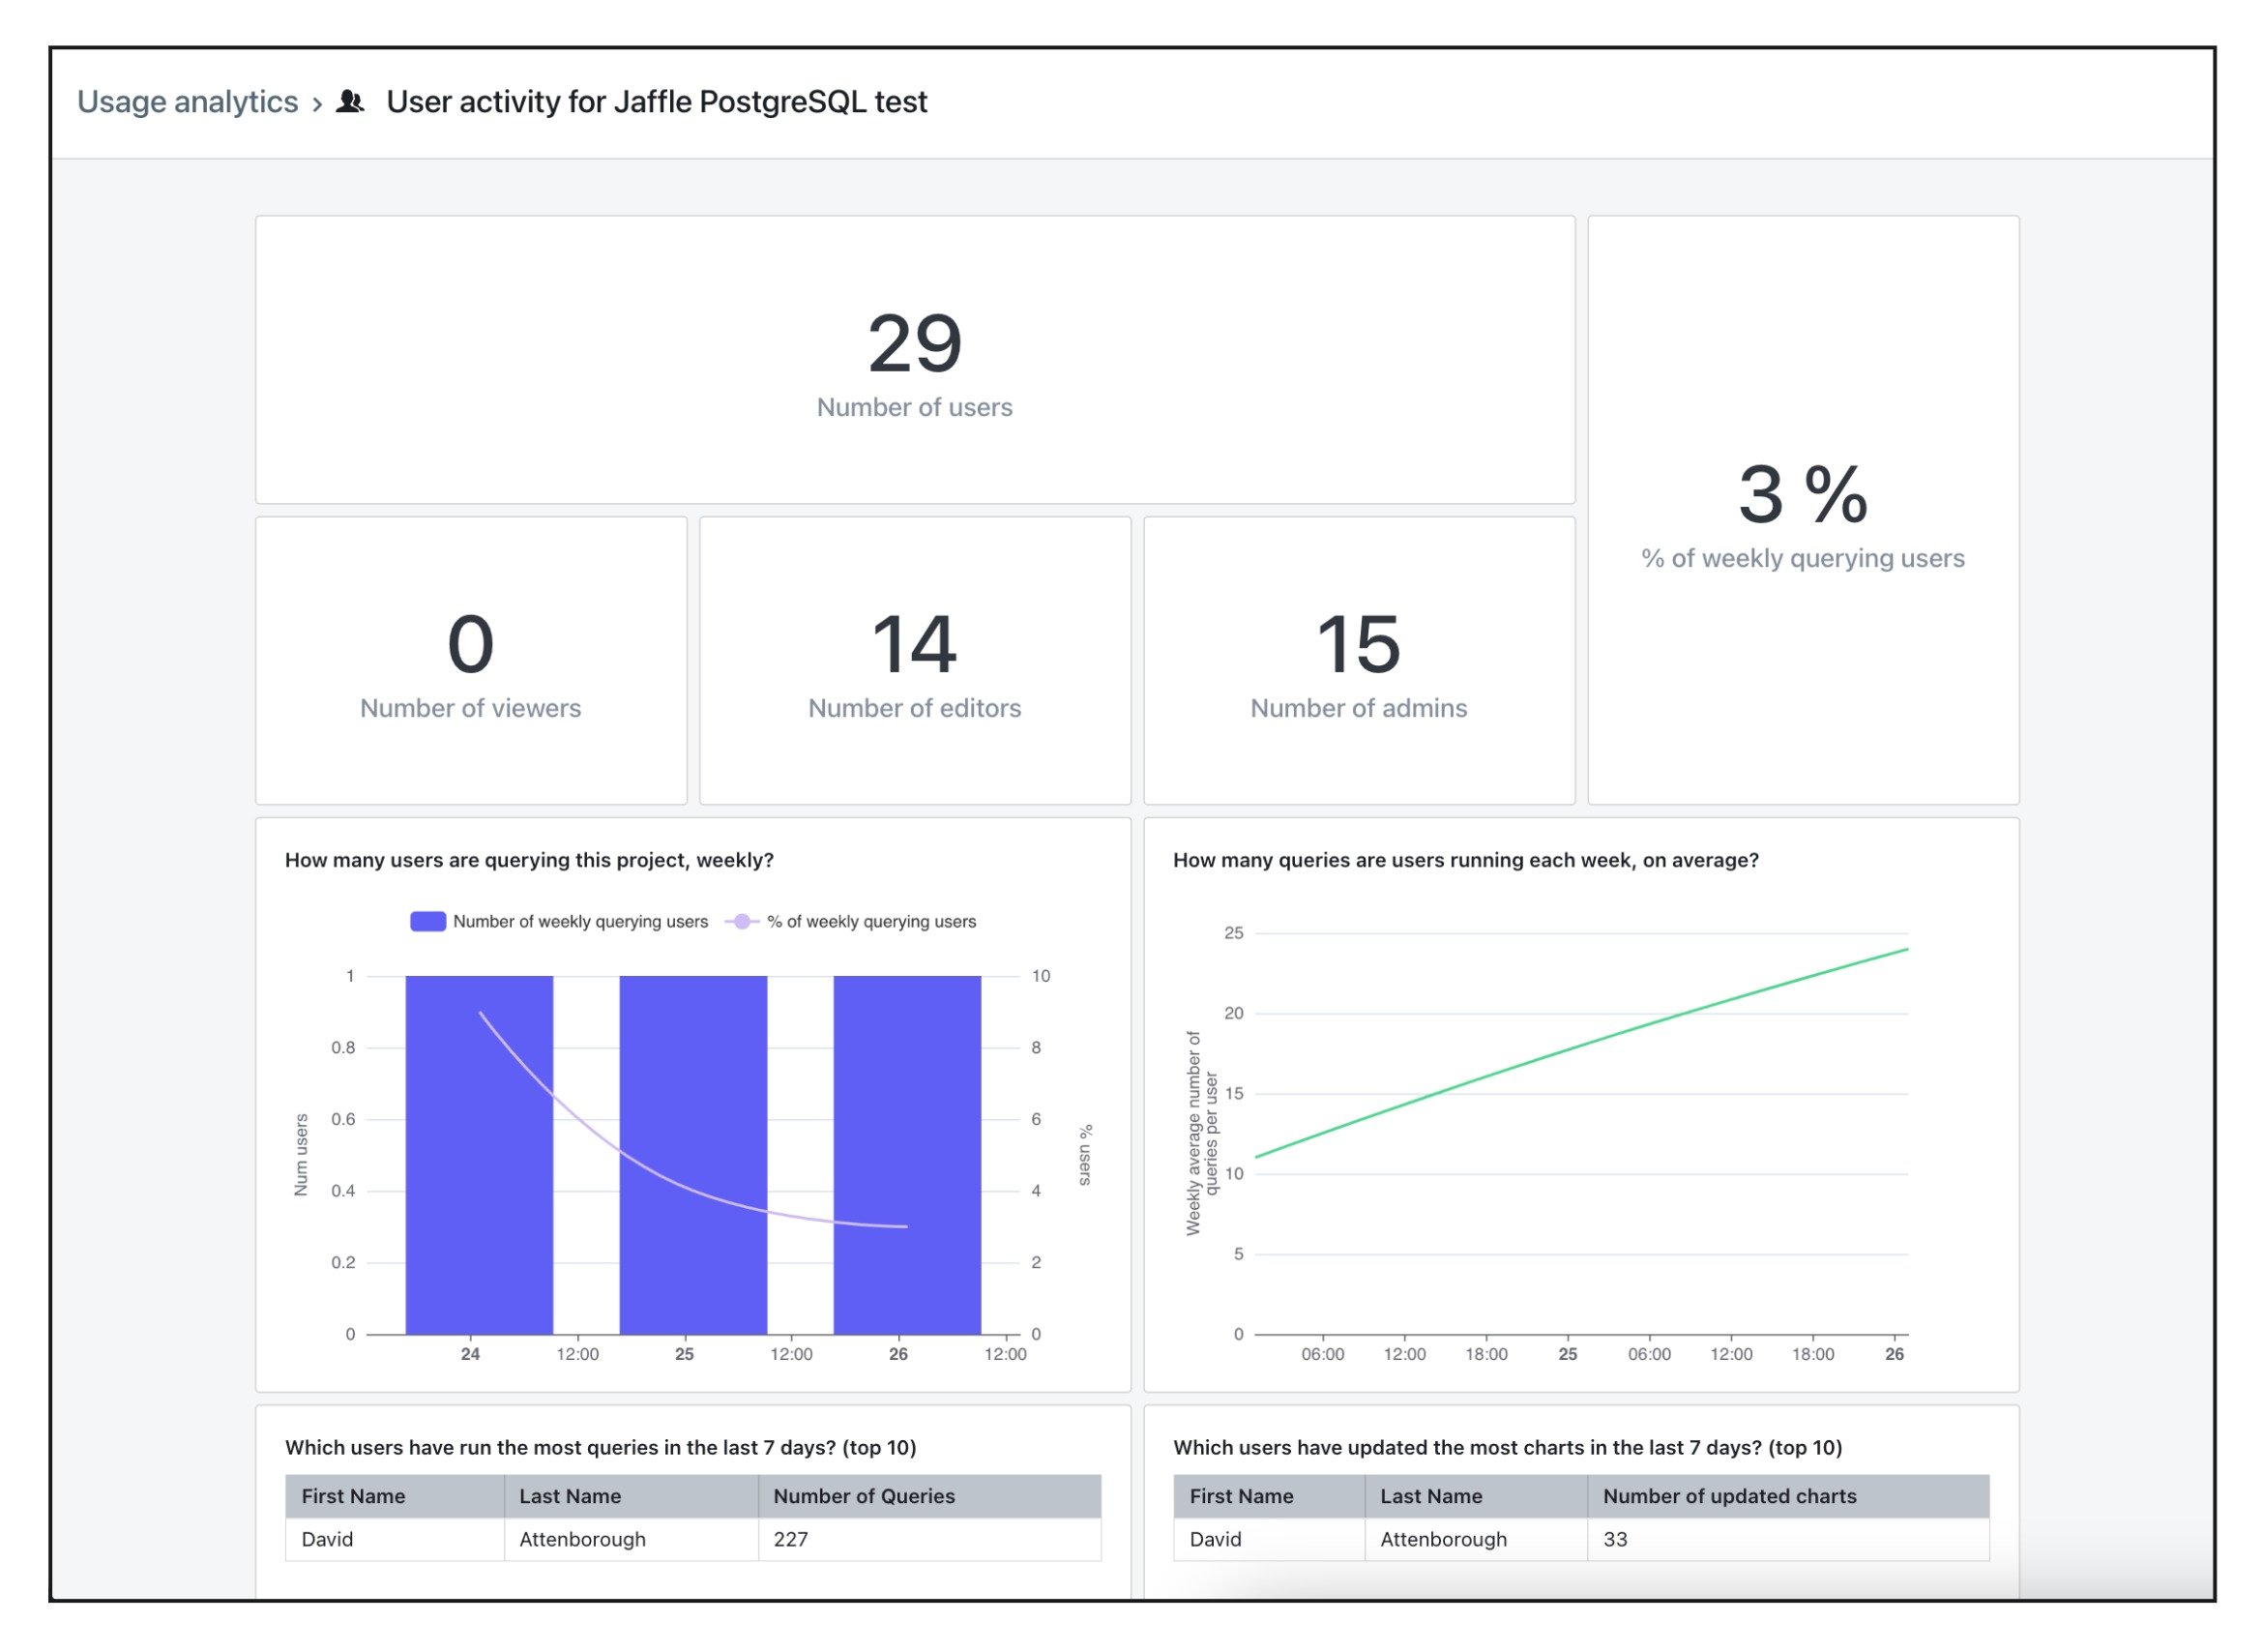 Here's an overview of the fields used in the dashboard:
* **Number of users**: the total number of users that have access to the project.
* **Number of viewers**: the number of users with the `viewer` role that have access to the project.
* **Number of editors**: the number of users with the `editor` role that have access to the project.
* **Number of admins**: the number of users with the `admin` role that have access to the project.
* **% of weekly querying users**: the % of users which have run at least one query in the project in the last 7 days (out of all users in your project). Queries include viewing existing charts and dashboards.
* **Number of weekly querying users**: the number of users which have run at least one query in the project in the last 7 days.
* **Weekly average number of queries per user**: the rolling 7 day average number of queries that each user is running in your project.
* **Users that have run the most queries in the last 7 days**: a list of the users that have run the most queries in your project in the last 7 days.
* **Users that have updated the most charts in the last 7 days**: a list of users that have updated (including created) the most charts in the project in the last 7 days.
* **Users that have not run a query in the last 90 days**: a list of users that have not run a query in the project in the last 7 days. This includes viewing charts and dashboards.
#### Extended usage analytics
Self-hosted instances can set the `EXTENDED_USAGE_ANALYTICS=true` environment variable to add two extra tables to the User Activity dashboard:
* **Dashboard views (top 20)**: ranks dashboards in the project by total view count.
* **Chart views (top 20)**: ranks charts in the project by total view count.
## Query tags
Query tags are metadata which is added to your data warehouse queries and gives you information about each query executed.
The following query tags are sent:
| Query Tag | Detail |
| :------------------------ | :--------------------------------------------------------------------------------------------------------------------------------------------------------------------------------------- |
| organization\_uuid | Lightdash organization unique identifier. |
| project\_uuid | Lightdash project unique identifier. |
| user\_uuid | User unique identifier for the user that triggered the query. |
| explore\_name | Name of the explore the query was run against. |
| chart\_uuid | Chart unique identifier. Only set when the query originates from a saved chart. |
| dashboard\_uuid | Dashboard unique identifier. Only set when the query originates from a dashboard. |
| saved\_sql\_uuid | Saved SQL chart unique identifier. Only set when a scheduled job is running a saved SQL chart. |
| scheduler\_uuid | Scheduler unique identifier. Only set when the query is triggered by a scheduled delivery, alert, or Google Sheets sync. |
| scheduler\_name | Human-readable name of the scheduler. Only set when the query is triggered by a scheduler. |
| job\_id | Scheduler job identifier for a single run of a scheduler. Only set when the query is triggered by a scheduler. |
| app\_uuid | Identifier of the external app that originated the request, taken from the app attribution header. Self-reported by the caller and used for attribution only. |
| query\_context | Which context the query was executed in. See [Query contexts](#query-contexts) below for the full list of values. |
| user\_attribute\_`` | One tag per [user attribute](/references/workspace/user-attributes) value assigned to the querying user. Applies to both regular users and embed viewers, and requires no configuration. |
### Query contexts
The `query_context` tag identifies which surface triggered the query. Possible values:
| Value | Where the query came from |
| :---------------------------- | :------------------------------------------------------------------------------------------- |
| `dashboardView` | Viewing a dashboard. |
| `autorefreshedDashboard` | Dashboard auto-refresh tick. |
| `exploreView` | Running a query from the explore view. |
| `chartView` | Viewing a saved chart. |
| `chartHistory` | Viewing a chart's version history. |
| `sqlChartView` | Viewing a saved SQL chart. |
| `sqlRunner` | Running a query from the SQL runner. |
| `viewUnderlyingData` | Viewing the underlying data behind a result cell. |
| `filterAutocomplete` | Autocomplete lookups for filter values. |
| `calculateTotal` | Calculating a column total. |
| `calculateSubtotal` | Calculating a group subtotal. |
| `metricsExplorer` | Queries from the Metrics Explorer. |
| `csvDownload` | CSV export of query results. |
| `gsheets` | Ad-hoc Google Sheets export. |
| `alert` | Scheduled alert evaluating its condition. |
| `scheduledDelivery` | Scheduled delivery running. |
| `scheduledChart` | Scheduled chart delivery. |
| `scheduledDashboard` | Scheduled dashboard delivery. |
| `scheduledGsheetsChart` | Scheduled Google Sheets sync for a chart. |
| `scheduledGsheetsDashboard` | Scheduled Google Sheets sync for a dashboard. |
| `scheduledGsheetsSqlChart` | Scheduled Google Sheets sync for a SQL chart. |
| `preAggregateMaterialization` | Building a pre-aggregate materialization. |
| `embed` | Query from an [embedded](/references/embedding) chart or dashboard. |
| `api` | Query issued through the Lightdash HTTP API. |
| `cli` | Query issued through the [Lightdash CLI](/references/lightdash-cli). |
| `ai` | Query issued by a [Lightdash AI agent](/guides/ai-agents/getting-started). |
| `mcp.run_metric_query` | `run_metric_query` tool call from the [Lightdash MCP server](/guides/ai-agents/mcp-servers). |
| `mcp.run_sql` | `run_sql` tool call from the Lightdash MCP server. |
| `mcp.search_field_values` | `search_field_values` tool call from the Lightdash MCP server. |
| `dataAppSample` | Sample query issued when previewing a data app. |
### User attribute tags
For every query, Lightdash emits an extra `user_attribute_` tag for each user attribute value assigned to the user running the query. This makes it possible to attribute warehouse cost, audit access, or debug row-level-security by user attribute directly from your warehouse's query history.
* Tags are emitted alongside the standard query tags for both signed-in users and embed viewers (using the attributes passed on the embed token).
* Values are carried through async query execution end-to-end, so they appear on the actual warehouse job (for example, as labels on a BigQuery job).
* Keys and values are sanitized to match warehouse tag constraints — lower-cased, restricted to `a-z 0-9 _ -`, and truncated if too long. Invalid or oversized metadata is sanitized rather than blocking the query.
* No configuration is required — user attribute tags are emitted automatically wherever query tags are already supported.
For example, a user with the `region` attribute set to `emea` and `customer_tier` set to `enterprise` will produce these additional tags on every warehouse query they trigger:
```text theme={null}
user_attribute_region=emea
user_attribute_customer_tier=enterprise
```
You can then filter your warehouse's query or job history by these tags (for example, `labels.user_attribute_region = "emea"` in BigQuery) to break down usage or cost by user attribute.
Query tags are stored differently in each data warehouse:
| Data Warehouse | Query Tag |
| :------------- | :--------------------------------------------------------------------------------------------------------------------------------------------------------------------------------------------------------- |
| BigQuery | Writes metadata as labels in your [job history](https://cloud.google.com/bigquery/docs/managing-jobs#view%5Fjob%5Fdetails%5F2). |
| Snowflake | Writes JSON metadata in the comment column of your [query history](https://docs.snowflake.com/en/user-guide/ui-history#viewing-query-details-and-results). |
| ClickHouse | Writes JSON metadata in the comment column of your [query log](https://clickhouse.com/docs/operations/system-tables/query_log). |
| Trino | Sends metadata as comma-separated `key=value` pairs in the [`X-Trino-Client-Tags`](https://trino.io/docs/current/develop/client-protocol.html#client-request-headers) HTTP header on each submitted query. |
| Redshift | Appends JSON metadata as a SQL comment in each submitted SQL query. |
| Databricks | Appends JSON metadata as a SQL comment in each submitted SQL query. |
| Postgres | Appends JSON metadata as a SQL comment in each submitted SQL query. |
| Athena | Appends JSON metadata as a SQL comment in each submitted SQL query. |
Here's an overview of the fields used in the dashboard:
* **Number of users**: the total number of users that have access to the project.
* **Number of viewers**: the number of users with the `viewer` role that have access to the project.
* **Number of editors**: the number of users with the `editor` role that have access to the project.
* **Number of admins**: the number of users with the `admin` role that have access to the project.
* **% of weekly querying users**: the % of users which have run at least one query in the project in the last 7 days (out of all users in your project). Queries include viewing existing charts and dashboards.
* **Number of weekly querying users**: the number of users which have run at least one query in the project in the last 7 days.
* **Weekly average number of queries per user**: the rolling 7 day average number of queries that each user is running in your project.
* **Users that have run the most queries in the last 7 days**: a list of the users that have run the most queries in your project in the last 7 days.
* **Users that have updated the most charts in the last 7 days**: a list of users that have updated (including created) the most charts in the project in the last 7 days.
* **Users that have not run a query in the last 90 days**: a list of users that have not run a query in the project in the last 7 days. This includes viewing charts and dashboards.
#### Extended usage analytics
Self-hosted instances can set the `EXTENDED_USAGE_ANALYTICS=true` environment variable to add two extra tables to the User Activity dashboard:
* **Dashboard views (top 20)**: ranks dashboards in the project by total view count.
* **Chart views (top 20)**: ranks charts in the project by total view count.
## Query tags
Query tags are metadata which is added to your data warehouse queries and gives you information about each query executed.
The following query tags are sent:
| Query Tag | Detail |
| :------------------------ | :--------------------------------------------------------------------------------------------------------------------------------------------------------------------------------------- |
| organization\_uuid | Lightdash organization unique identifier. |
| project\_uuid | Lightdash project unique identifier. |
| user\_uuid | User unique identifier for the user that triggered the query. |
| explore\_name | Name of the explore the query was run against. |
| chart\_uuid | Chart unique identifier. Only set when the query originates from a saved chart. |
| dashboard\_uuid | Dashboard unique identifier. Only set when the query originates from a dashboard. |
| saved\_sql\_uuid | Saved SQL chart unique identifier. Only set when a scheduled job is running a saved SQL chart. |
| scheduler\_uuid | Scheduler unique identifier. Only set when the query is triggered by a scheduled delivery, alert, or Google Sheets sync. |
| scheduler\_name | Human-readable name of the scheduler. Only set when the query is triggered by a scheduler. |
| job\_id | Scheduler job identifier for a single run of a scheduler. Only set when the query is triggered by a scheduler. |
| app\_uuid | Identifier of the external app that originated the request, taken from the app attribution header. Self-reported by the caller and used for attribution only. |
| query\_context | Which context the query was executed in. See [Query contexts](#query-contexts) below for the full list of values. |
| user\_attribute\_`` | One tag per [user attribute](/references/workspace/user-attributes) value assigned to the querying user. Applies to both regular users and embed viewers, and requires no configuration. |
### Query contexts
The `query_context` tag identifies which surface triggered the query. Possible values:
| Value | Where the query came from |
| :---------------------------- | :------------------------------------------------------------------------------------------- |
| `dashboardView` | Viewing a dashboard. |
| `autorefreshedDashboard` | Dashboard auto-refresh tick. |
| `exploreView` | Running a query from the explore view. |
| `chartView` | Viewing a saved chart. |
| `chartHistory` | Viewing a chart's version history. |
| `sqlChartView` | Viewing a saved SQL chart. |
| `sqlRunner` | Running a query from the SQL runner. |
| `viewUnderlyingData` | Viewing the underlying data behind a result cell. |
| `filterAutocomplete` | Autocomplete lookups for filter values. |
| `calculateTotal` | Calculating a column total. |
| `calculateSubtotal` | Calculating a group subtotal. |
| `metricsExplorer` | Queries from the Metrics Explorer. |
| `csvDownload` | CSV export of query results. |
| `gsheets` | Ad-hoc Google Sheets export. |
| `alert` | Scheduled alert evaluating its condition. |
| `scheduledDelivery` | Scheduled delivery running. |
| `scheduledChart` | Scheduled chart delivery. |
| `scheduledDashboard` | Scheduled dashboard delivery. |
| `scheduledGsheetsChart` | Scheduled Google Sheets sync for a chart. |
| `scheduledGsheetsDashboard` | Scheduled Google Sheets sync for a dashboard. |
| `scheduledGsheetsSqlChart` | Scheduled Google Sheets sync for a SQL chart. |
| `preAggregateMaterialization` | Building a pre-aggregate materialization. |
| `embed` | Query from an [embedded](/references/embedding) chart or dashboard. |
| `api` | Query issued through the Lightdash HTTP API. |
| `cli` | Query issued through the [Lightdash CLI](/references/lightdash-cli). |
| `ai` | Query issued by a [Lightdash AI agent](/guides/ai-agents/getting-started). |
| `mcp.run_metric_query` | `run_metric_query` tool call from the [Lightdash MCP server](/guides/ai-agents/mcp-servers). |
| `mcp.run_sql` | `run_sql` tool call from the Lightdash MCP server. |
| `mcp.search_field_values` | `search_field_values` tool call from the Lightdash MCP server. |
| `dataAppSample` | Sample query issued when previewing a data app. |
### User attribute tags
For every query, Lightdash emits an extra `user_attribute_` tag for each user attribute value assigned to the user running the query. This makes it possible to attribute warehouse cost, audit access, or debug row-level-security by user attribute directly from your warehouse's query history.
* Tags are emitted alongside the standard query tags for both signed-in users and embed viewers (using the attributes passed on the embed token).
* Values are carried through async query execution end-to-end, so they appear on the actual warehouse job (for example, as labels on a BigQuery job).
* Keys and values are sanitized to match warehouse tag constraints — lower-cased, restricted to `a-z 0-9 _ -`, and truncated if too long. Invalid or oversized metadata is sanitized rather than blocking the query.
* No configuration is required — user attribute tags are emitted automatically wherever query tags are already supported.
For example, a user with the `region` attribute set to `emea` and `customer_tier` set to `enterprise` will produce these additional tags on every warehouse query they trigger:
```text theme={null}
user_attribute_region=emea
user_attribute_customer_tier=enterprise
```
You can then filter your warehouse's query or job history by these tags (for example, `labels.user_attribute_region = "emea"` in BigQuery) to break down usage or cost by user attribute.
Query tags are stored differently in each data warehouse:
| Data Warehouse | Query Tag |
| :------------- | :--------------------------------------------------------------------------------------------------------------------------------------------------------------------------------------------------------- |
| BigQuery | Writes metadata as labels in your [job history](https://cloud.google.com/bigquery/docs/managing-jobs#view%5Fjob%5Fdetails%5F2). |
| Snowflake | Writes JSON metadata in the comment column of your [query history](https://docs.snowflake.com/en/user-guide/ui-history#viewing-query-details-and-results). |
| ClickHouse | Writes JSON metadata in the comment column of your [query log](https://clickhouse.com/docs/operations/system-tables/query_log). |
| Trino | Sends metadata as comma-separated `key=value` pairs in the [`X-Trino-Client-Tags`](https://trino.io/docs/current/develop/client-protocol.html#client-request-headers) HTTP header on each submitted query. |
| Redshift | Appends JSON metadata as a SQL comment in each submitted SQL query. |
| Databricks | Appends JSON metadata as a SQL comment in each submitted SQL query. |
| Postgres | Appends JSON metadata as a SQL comment in each submitted SQL query. |
| Athena | Appends JSON metadata as a SQL comment in each submitted SQL query. |